Grafana Alerting vs Alertmanager: rules, routing and coexistence
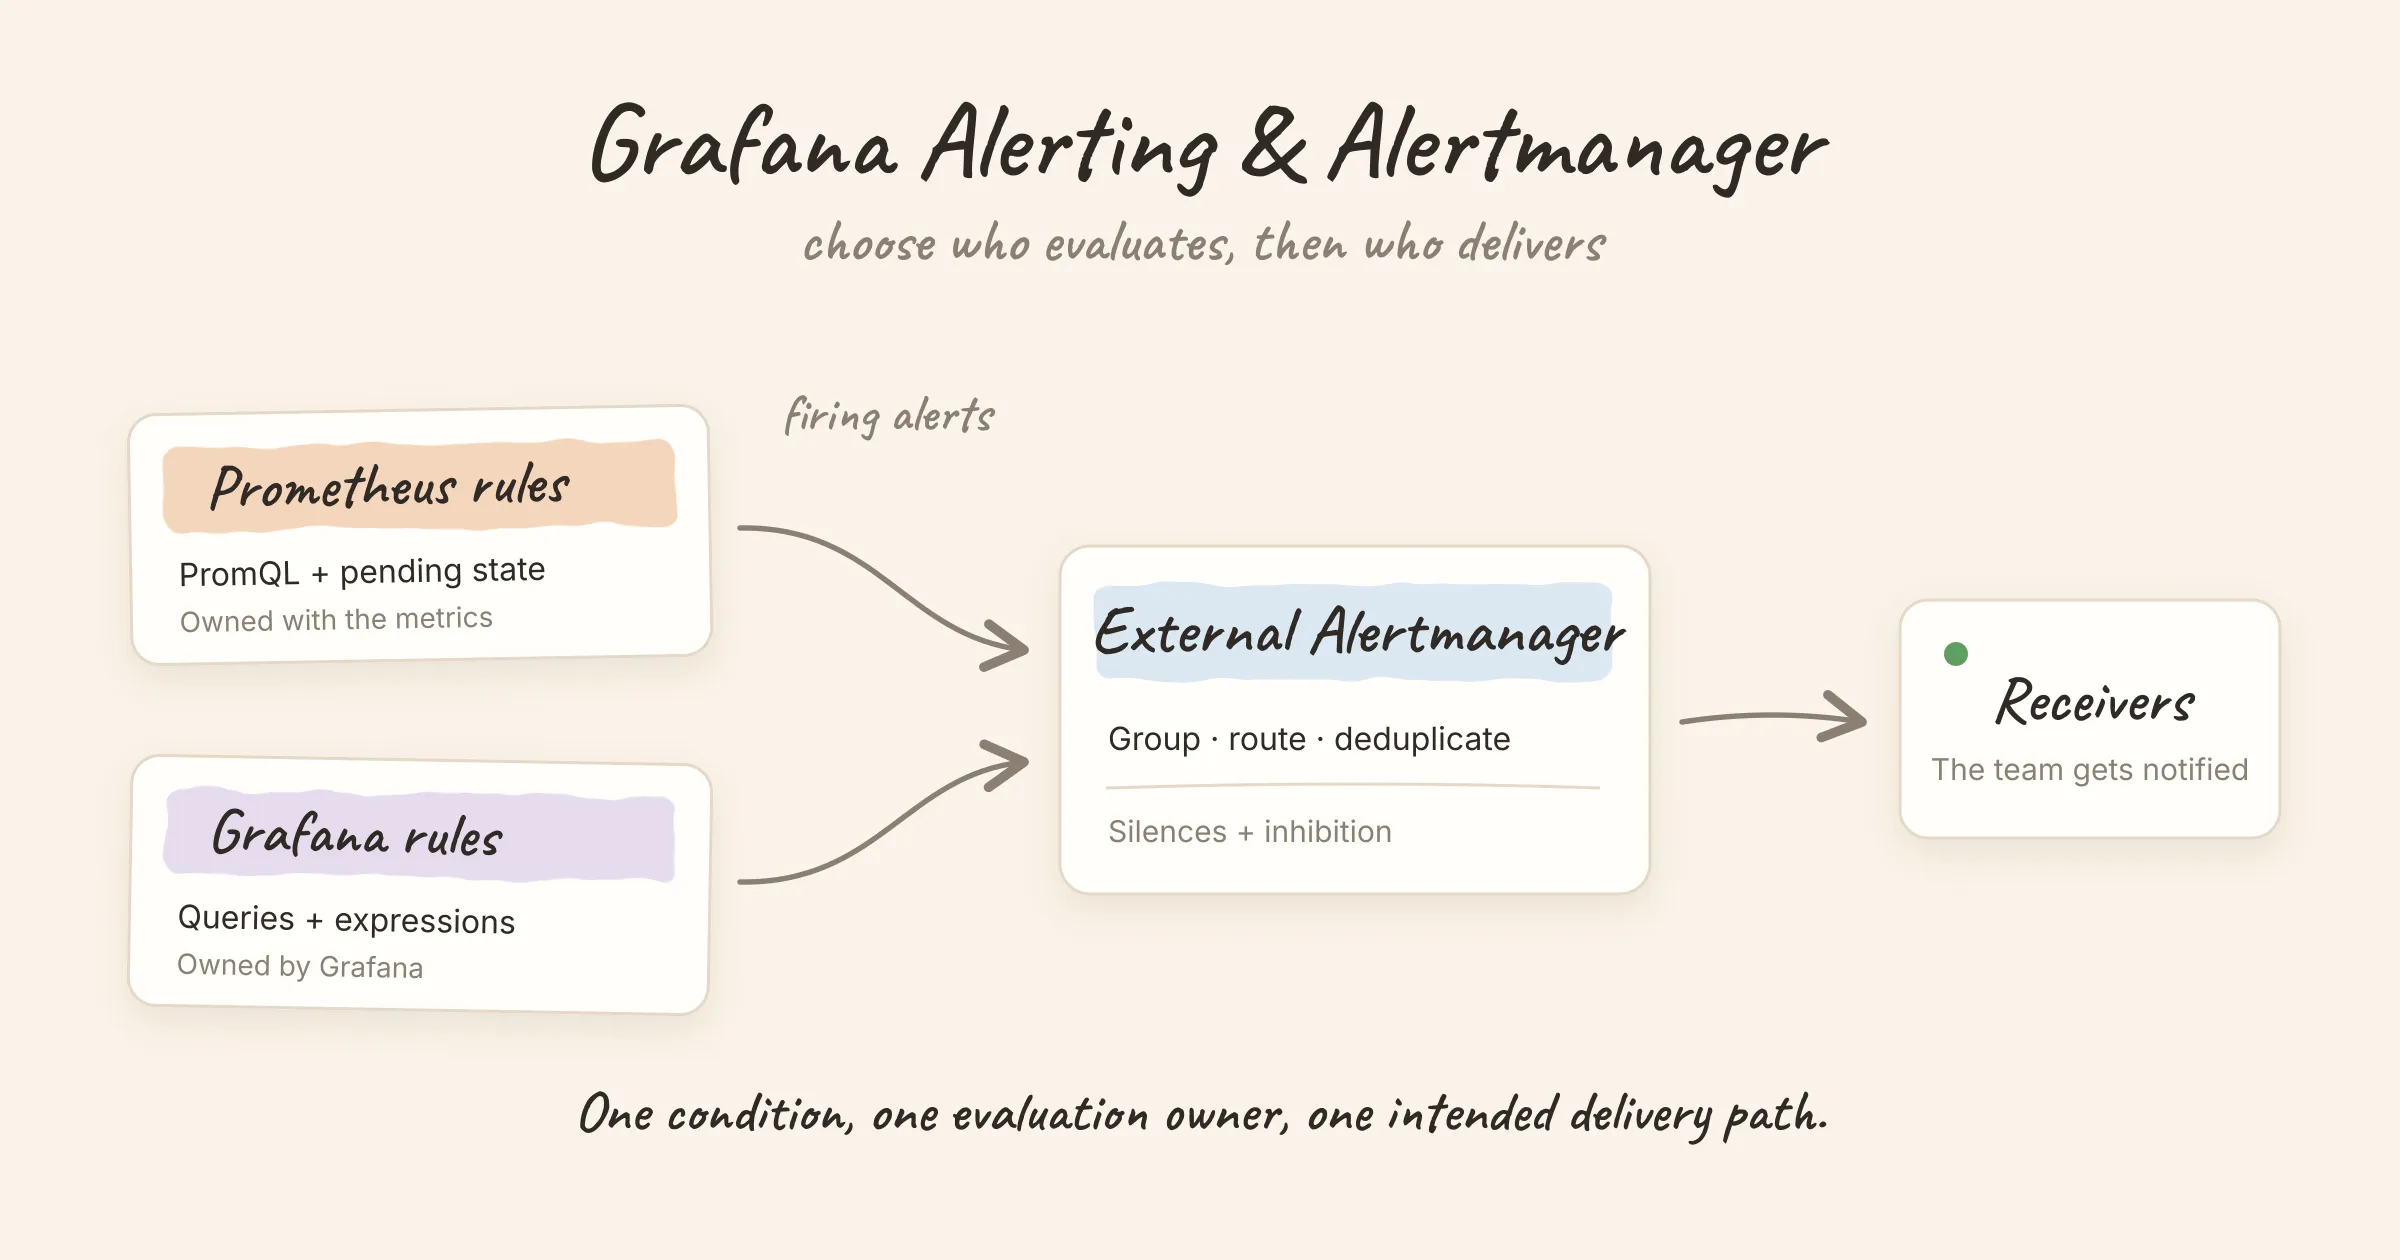
Choose Prometheus with Alertmanager when your rules belong with your metrics and are maintained as code. Choose Grafana-managed alerting when you need Grafana to evaluate queries across supported data sources and manage conditions through its UI or provisioning tools. You can also keep Prometheus rules, add Grafana-managed rules for other data, and use the same external Alertmanager for notification delivery.
The important decision is where a rule runs and who owns its notifications. Here is how to make those choices without evaluating the same condition twice.
What you are comparing
Prometheus evaluates PromQL alerting rules. When an expression produces a matching label set, Prometheus tracks that alert's state and, once its pending period has elapsed, sends a firing alert downstream. Alertmanager handles the delivery side: deduplication, grouping, routing, silences and inhibition. It does not query your metrics or evaluate the PromQL threshold. See the official alerting rules and Alertmanager overview.
Grafana Alerting includes a rule evaluator and notification management. With a Grafana-managed rule, Grafana executes the queries, evaluates the condition and produces alert instances. Its notification configuration then decides where those alerts go. The data source must support backend alerting; a query that works on a dashboard is not sufficient proof. Grafana documents that requirement here.
Two common paths therefore look like this:
Prometheus evaluates rules → Prometheus Alertmanager → receivers

Grafana evaluates rules    → Grafana's Alertmanager   → contact points
The storage system can be the same Prometheus in both cases. Moving evaluation to Grafana does not require moving the stored metrics.
Grafana Alerting vs Prometheus + Alertmanager
| Decision | Prometheus + Alertmanager | Grafana-managed alerting |
|---|---|---|
| Who evaluates the condition? | Prometheus | Grafana |
| What can the rule query? | Data accessible through PromQL | Supported backend data sources; rules can combine queries and expressions |
| Where is the rule maintained? | Prometheus rule files; commonly generated or deployed through GitOps | Grafana UI, provisioning files, Terraform or APIs |
| Who handles delivery? | External Alertmanager | Grafana's notification system, or a configured external Alertmanager |
| How are destinations selected? | Alertmanager routes and receivers | Contact points and notification policies, or the external Alertmanager's configuration |
| Can dashboards stay in Grafana? | Yes | Yes |
| Who diagnoses an evaluation failure? | The team operating Prometheus and its rule configuration | The team operating Grafana alert evaluation and its data source access |
Both designs can be managed as code. Grafana's UI is a useful option, and its provisioning tools also support reviewable configuration. Decide who is allowed to edit provisioned resources and how those edits are deployed before treating either UI as the source of truth.
Three setups that are easy to confuse
1. Grafana displays alerts that another system evaluates
With a data source-managed rule, a compatible external system stores and evaluates the rule. Grafana provides an interface to it. Grafana's documentation describes this separately from Grafana-managed rules.
Check which API the data source exposes. A Mimir or Loki ruler, a plain Prometheus server and an Alertmanager do different jobs. Adding an Alertmanager data source does not give Grafana a general-purpose API for editing Prometheus rule files.
2. Grafana evaluates rules and uses its own notifications
Grafana owns both the evaluation and the delivery configuration. This fits a team that already operates Grafana, needs conditions over multiple supported sources, and wants one place to maintain those rules.
For each data source, verify the evaluator's credentials and network access. A dashboard viewed by a logged-in person and a background alert evaluation can have different access conditions.
3. Grafana evaluates rules and sends them to an external Alertmanager
This is a useful coexistence model:
Prometheus rules ─┐
                 ├→ external Alertmanager → existing receivers
Grafana rules ────┘
It lets a team keep its established routes and receivers while adding Grafana-managed evaluation. Grafana documents two ways to configure this: forward all Grafana-managed alerts to an enabled Alertmanager, or use an Alertmanager contact point for selected alerts. Adding the data source alone does not enable forwarding.
Keep the route labels consistent. For example, both evaluators might attach team="payments" and env="prod", so an existing payments route can match either source. The alert names should still describe the conditions distinctly.
A small example: who detects the outage?
Here is a Prometheus rule that checks whether a scraped target has been unreachable for five minutes:
groups:
  - name: service-availability
    rules:
      - alert: ServiceTargetDown
        expr: up{job="checkout"} == 0
        for: 5m
        labels:
          severity: warning
          team: payments
        annotations:
          summary: "Checkout target is unreachable"
Prometheus evaluates up, owns the five-minute pending state and sends the alert with the team label. Alertmanager can then route it to the payments receiver.
If you recreate the condition as a Grafana-managed rule, Grafana becomes a second evaluator. That may be appropriate during a controlled comparison, but leaving both enabled creates two independent alert identities. Sharing a destination does not guarantee they will deduplicate.
Also distinguish zero from missing. This expression matches a target whose up value is zero. It does not match a target that has disappeared from discovery and no longer has a current series. Test that case separately. Grafana-managed rules also have explicit No Data and Error handling, which should be reviewed when translating a rule.
Can Grafana edit Alertmanager routes?
The answer depends on the Alertmanager implementation. For a Prometheus Alertmanager, Grafana can manage silences, but contact points, notification policies and templates are read-only in that integration: its HTTP API does not support updating those resources. Edit and deploy the external configuration through the system that owns it. Grafana calls out this limitation.
This matters when the original requirement is simply “give us a UI.” Viewing an alert, adding a silence, editing a routing tree and authoring a detection rule are four separate capabilities. Check which one your team needs before changing the architecture.
How to choose
- Keep Prometheus evaluation when the rules already live alongside instrumentation, changes go through code review, and PromQL covers the detection requirements. Use Grafana for dashboards and Alertmanager for delivery.
- Choose Grafana-managed evaluation when a team needs its query and expression workflow over supported data sources, and is prepared to operate Grafana as an alerting dependency.
- Use both with an external Alertmanager when evaluation belongs in different systems but notification ownership should remain centralized. Document which system evaluates each condition.
Start a migration with one non-critical rule. Compare its labels, firing time, recovery behavior and destination against the existing rule. Include an empty result and a failed query in the check. Then disable the old evaluator for that condition and verify that only the intended notification path remains.
High availability needs a separate review. A working dashboard does not demonstrate that evaluation and delivery will survive a failed instance. Our Prometheus HA guide separates storage redundancy from alerting redundancy.
Where Nightingale fits
Nightingale is another evaluation option when rules need business-group ownership and a UI across metrics, logs and SQL sources. Its Grafana Alerting comparison and Prometheus + Alertmanager comparison describe the relevant trade-offs. For a database example, see SQL query alerting on failed MySQL orders.
For the wider choice, the open-source alerting platform guide separates rule evaluators, aggregation layers and on-call tools. Choose the layer that solves the operational requirement first.